IDEA: Open-Source Visualisation Tool

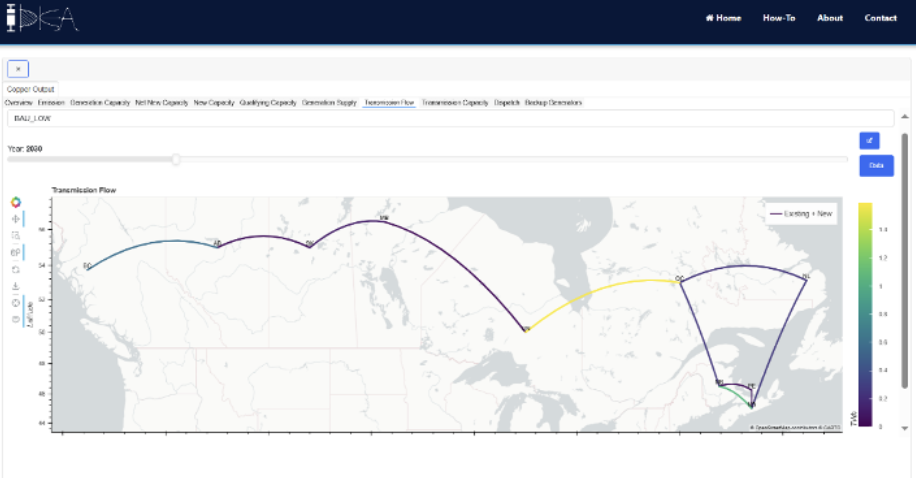
IDEA stands as a multi-faceted platform that serves both modelers and analysts effectively. During the development phase, modelers can use IDEA to meticulously review both inputs and outputs, ensuring that the model precisely aligns with their set objectives. Following the generation of results, IDEA empowers users to thoroughly examine their data, investigate research queries, and extract practical insights. The interactive nature of the visualizations allows users to manipulate years, regions, and scenarios, fostering a dynamic and user-centric experience.
This tool is adeptly designed for use either as a standalone tool, accessible directly from its GitLab repository, or as an integrated component of the M3 platform. One of IDEA’s key features is its ability to automatically activate post-model execution, thereby facilitating a smooth and uninterrupted modeling workflow.

IDEA is designed to cater to the diverse needs of researchers by offering two primary modes of operation. Researchers have the option to create custom profiles for their models programmatically, tailoring the tool to fit their specific requirements. Alternatively, IDEA supports the use of data in the IAMC format. This compatibility enables IDEA to generate a simple, yet effective, generic dashboard, an aspect currently under continuous development.
The adoption of the IAMC format as the default setting aligns with the best practices of integrated assessment models internationally. This approach ensures that IDEA remains a relevant and effective tool in the global research community, adhering to widely recognized standards and practices.
IDEA currently supports custom dashboards and plots for various model outputs, including COPPER (Emissions, Capacity, New Capacity, Net New Capacity, Supply, Transmission Flow, Capacity, Dispatch) and SILVER (OPF Costs, OPF Results, Price OPF, UC Results). Over time, the platform will be continually expanded to accommodate a wider array of models and outputs.

IDEA transcends the traditional boundaries of visualization tools. It empowers users with the ability to not only view but also interactively edit plots directly within the platform. This includes accessing plot data in CSV format for detailed analysis and saving plots as images, perfect for incorporating into presentations or reports. This high degree of interactivity and adaptability sets IDEA apart as a robust, user-friendly platform in the realm of energy modeling.
As an open-source initiative, IDEA fosters a spirit of collaboration and innovation within the modeling community. Its presence on GitLab enhances its transparency and ease of access, contributing to the continuous evolution of its features. In the rapidly changing landscape of energy transition, IDEA emerges as a vital tool for those looking to demystify the complexities of modeling and facilitate informed decision-making.

To start using IDEA, you have two primary options. First, you can access it as a standalone tool directly from its GitLab repository. This allows for immediate use and exploration of its features. Alternatively, IDEA can be integrated into the M3 platform, offering a more comprehensive experience.
For more information, or if you have any questions about using IDEA, please don’t hesitate to contact us at [email protected]. Our team is ready to assist you and provide any additional details you may need to make the most of this innovative tool.
For more details, check-out the IDEA wiki.
Discover the full potential of IDEA today and enhance your energy modelling capabilities!